

In today's tech-driven world, monitoring your infrastructure is vital to ensure seamless operations and rapid issue resolution. That's where Prometheus, Grafana, cAdvisor, and Node Exporter come into play!
Prometheus with Grafana:
Prometheus, an open-source monitoring and alerting toolkit, helps you collect and store time-series data. It allows you to gain insights into your applications and infrastructure.
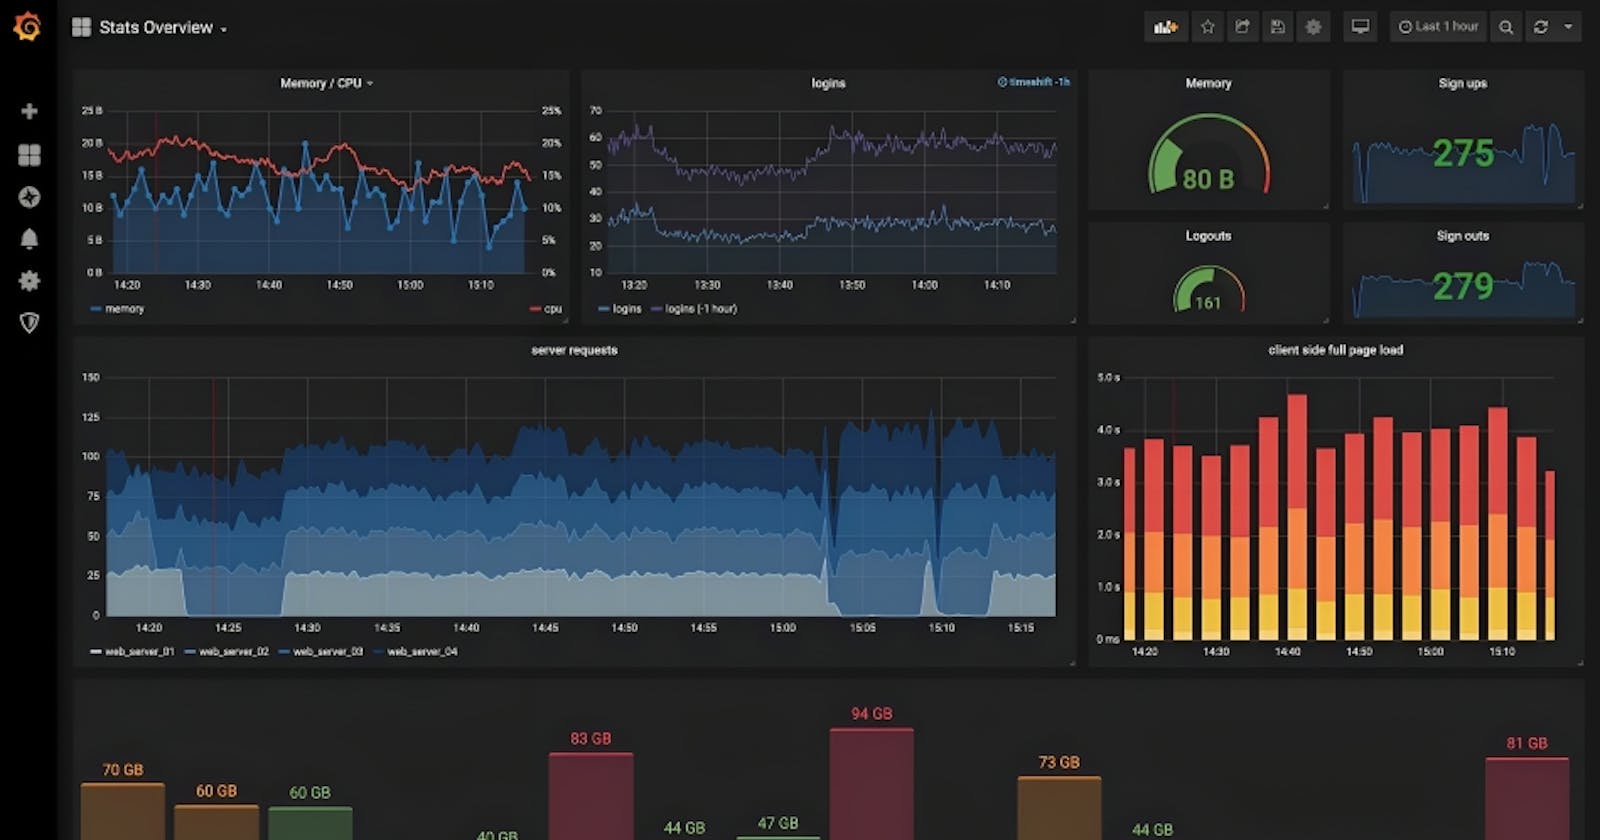
Grafana, a powerful visualization and dashboard tool, complements Prometheus beautifully. It turns your data into beautiful, customizable graphs, charts, and alerts.
Together, they create a dynamic duo for monitoring, alerting, and visualization.
cAdvisor and Node Exporter:
cAdvisor, short for Container Advisor, provides real-time monitoring for containerized applications. It automatically discovers containers on a host and collects valuable resource usage and performance metrics.
Node Exporter, on the other hand, focuses on the host machine, exposing hardware and OS metrics. It's the go-to tool for monitoring server resources.
The combination of these tools empowers you to:
Gain deep insights into the performance of your applications, containers, and infrastructure.
Detect and troubleshoot issues in real time, ensuring high availability and reliability.
Create custom dashboards, alerts, and visualizations tailored to your specific needs.
Are you ready to unlock the full potential of your DevOps game?
Stay tuned for upcoming posts where we'll dive deeper into the setup, configuration, and best practices for utilizing these monitoring tools effectively.
Happy monitoring and stay tuned for more DevOps insights! 🤗🤗